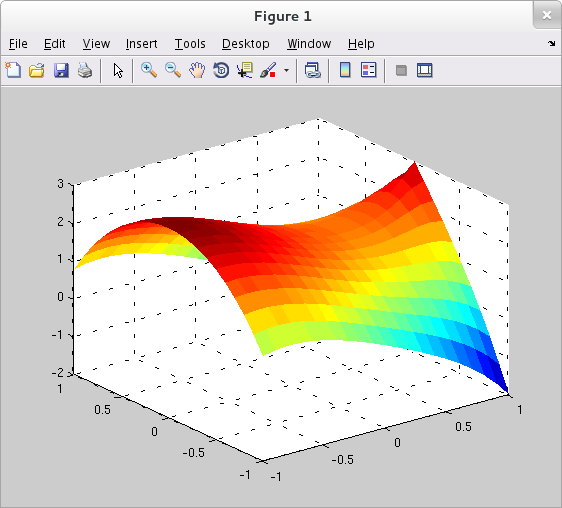
The following MATLAB code creates a plot of the two variable function $f$ given by $f(x,y)=3-\sqrt{(x-1)^2+y^2}((x+1)^2+y^2)$ over the square $-1\leq x\leq 1, -1\leq y\leq 1$.
>> [x,y] = meshgrid(-1:.1:1, -1:.1:1); >> z = 3 - sqrt( (x-1).^2 + y.^2 ).*( (x+1).^2 + y.^2 ); >> surf(x,y,z, 'EdgeColor','none');
Alternatively, the code
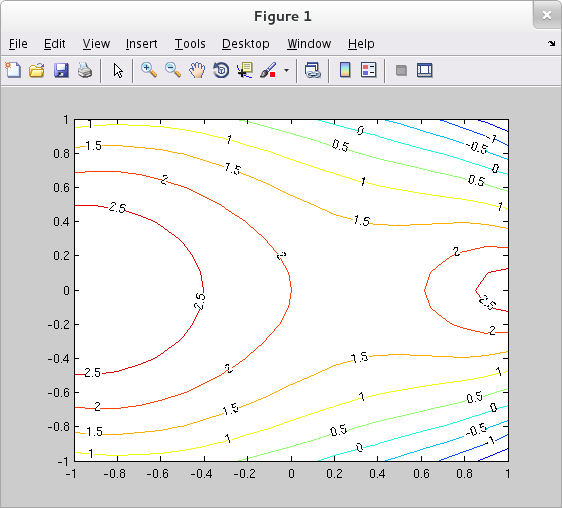
>> [x,y] = meshgrid(-1:.1:1, -1:.1:1); >> z = 3 - sqrt( (x-1).^2 + y.^2 ).*( (x+1).^2 + y.^2 ); >> [c,h] = contour(x,y,z); >> clabel(c,h);
can be used to create a labelled contour diagram (a.k.a. level curve diagram) for $f$.
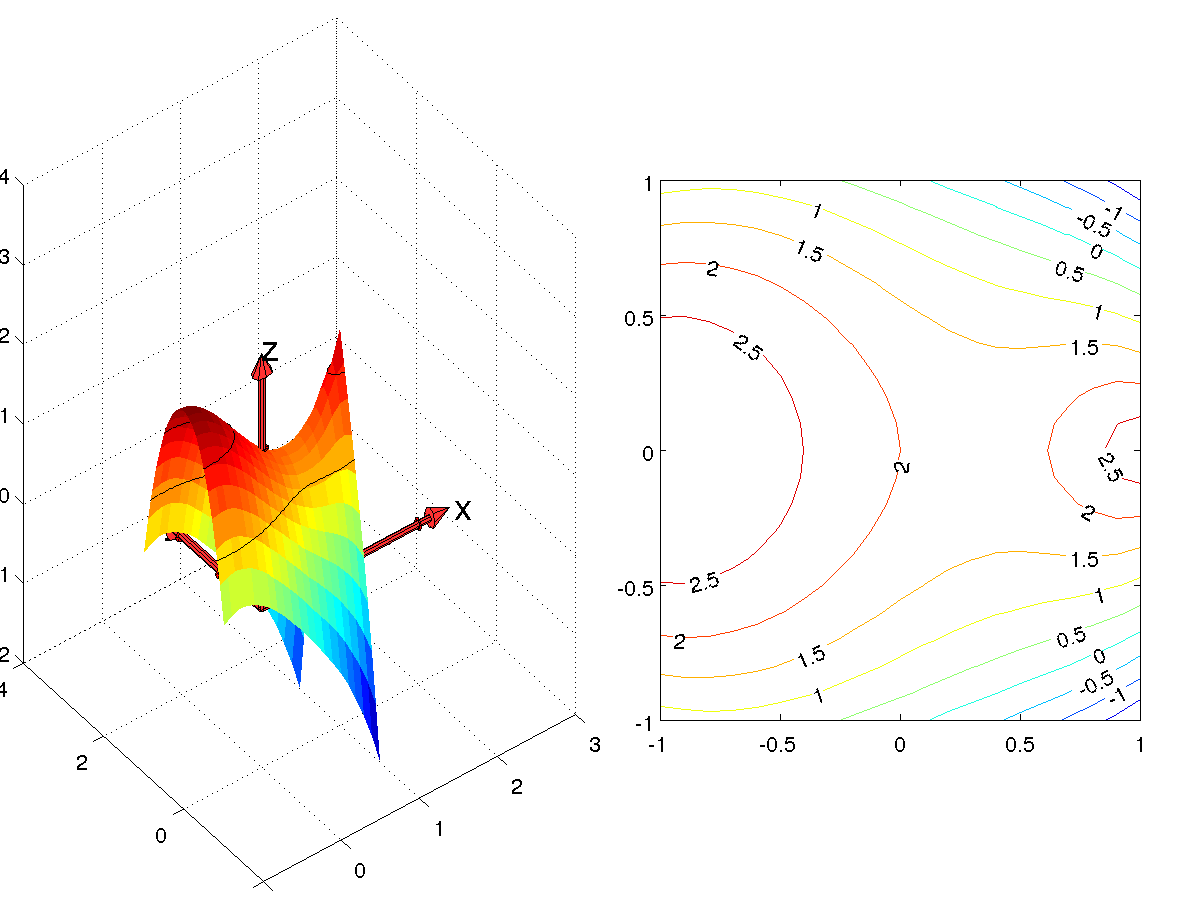
The command surfc may be used to combine a surface plot and a contour diagram into a single picture.
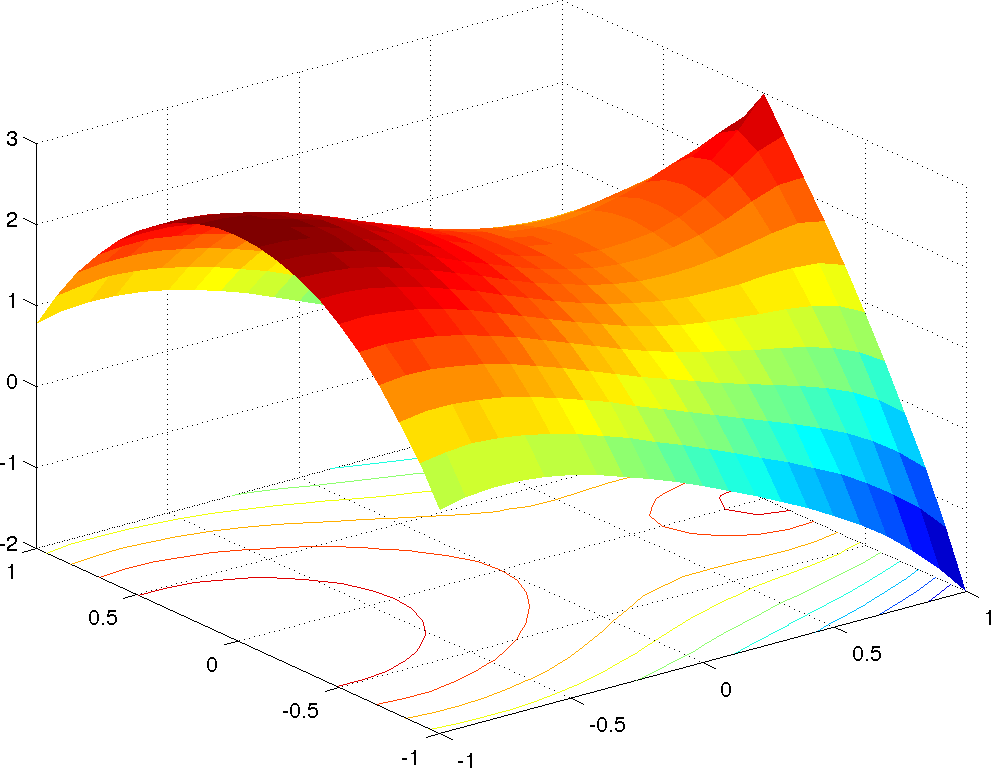
A hack ( levelcurves1.m ) to display a surface plot (with select level contours drawn on the surface plot itself) side-by-side with a labelled contour diagram.
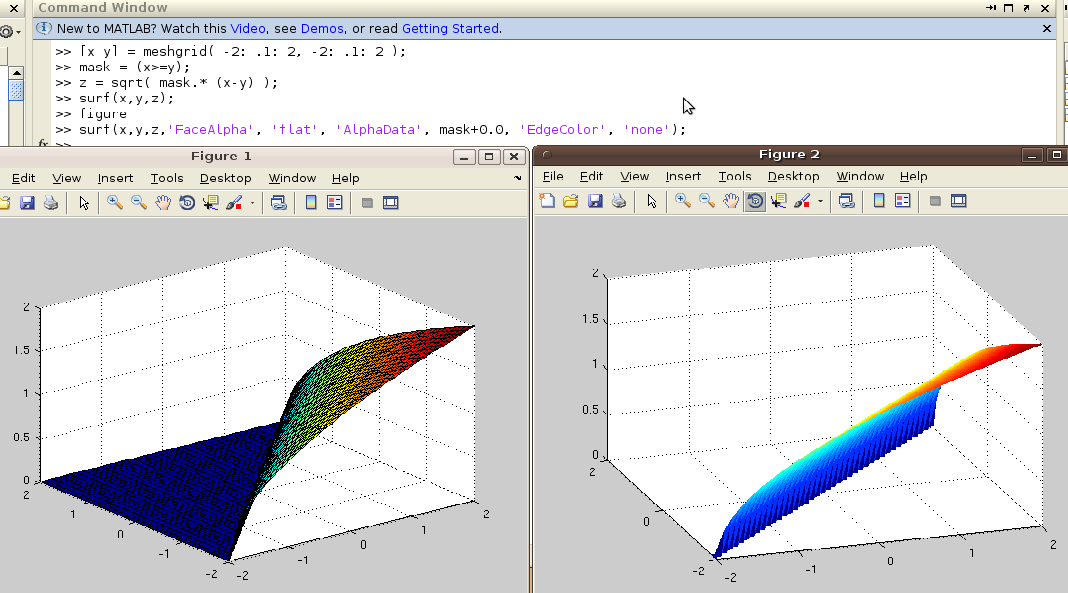
A hack to plot a function of two variables over a non-rectangular domain: