Generalized cylinder animation:
The animations hyp1.avi and hyp2.avi show the traces of a hyperboloid of two sheets in horizontal and vertical planes, respectively. The animation hyperboloids.avi illustrates the effect of varying $d$ in the equation $x^2+y^2-z^2=d$. For negative values of $d$ the solution sets are hyperboloids of two sheets. For positive values, we see hyperboloids of one sheet. The borderline case, $d=0$, is a cone.
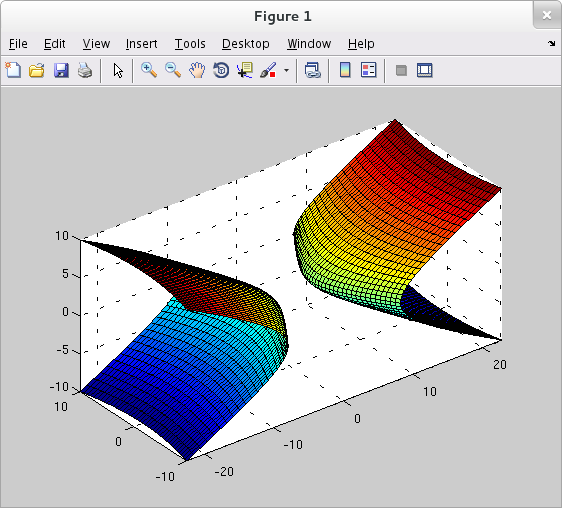
Solving for $x$ in the equation ${\displaystyle \frac{x^2}{9}-\frac{y^2}{16}-\frac{z^2}{2}=1}$ produces a plus-minus square root pair corresponding to the two sheets of the hyperboloid. The hyperboloid can be plotted with the code below.
>> [y,z] = meshgrid(-10:.5:10, -10:.5:10); >> x = sqrt( 9 * ( 1 + y.^2/16 + z.^2/2 ) ); >> surf(x,y,z) >> hold on >> surf(-x,y,z) >> axis equal
Notice that solving for $y$ (or $z$) as a plus-minus square root pair is problematic since there are $(x,z)$ pairs (resp. $(x,y)$ pairs) which would yield negative values under the square root.
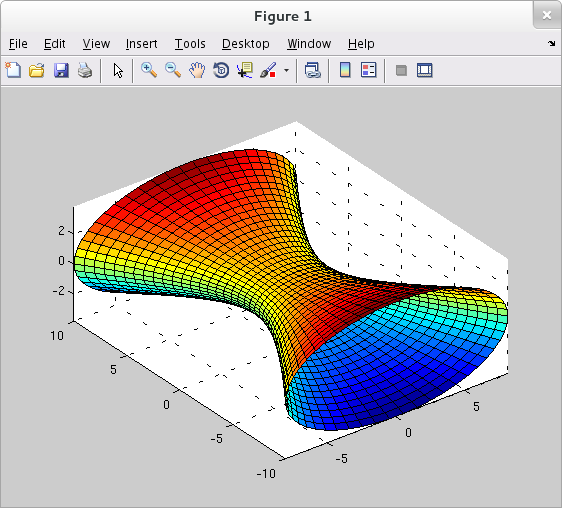
Now let's tweak the original equation to ${\displaystyle \frac{x^2}{9}-\frac{y^2}{16}+\frac{z^2}{2}=1}$. The sign change of course makes a qualitative difference. The new equation represents a hyperboloid of one sheet. Solving for any one of the three variables in terms of the other two leaves us with the problem of negatives under a square root for some variable values. While there are many ways to overcome this difficulty, one of the most flexible methods is to use parametric equations. For any fixed value of $y$ (i.e. in any plane parallel to the $x,z$-plane) the corresponding trace of the hyperboloid is the ellipse ${\displaystyle \frac{x^2}{9}+\frac{z^2}{2} = 1+\frac{y^2}{16}}$, or, equivalently, ${\displaystyle \frac{x^2}{9(1+\frac{y^2}{16})} + \frac{z^2}{2(1+\frac{y^2}{16})}=1}$. This ellipse may be parameterized as ${\displaystyle \left\{\begin{array}{ll} x = \sqrt{9(1+\frac{y^2}{16})}\cos{\theta} \\ z = \sqrt{2(1+\frac{y^2}{16})}\sin{\theta} \end{array}\right.}$ for $0\leq\theta\leq 2\pi$. And so we may use the following plotting procedure.
>> [y,th] = meshgrid(-10:.5:10, 0:pi/25:2*pi); >> x = sqrt(9*(1+y.^2/16)).*cos(th); >> z = sqrt(2*(1+y.^2/16)).*sin(th); >> surf(x,y,z) >> axis equal
Can we use a similar parametric approach to plot the hyperboloid of two sheets discussed above? Of course... but we should be careful and take into account that $x\geq 3$ for the front sheet. For a fixed $x$ value greater than $3$, the trace is the ellipse ${\displaystyle \frac{y^2}{16}+\frac{z^2}{2} = \frac{x^2}{9}-1}$, equivalently, ${\displaystyle \frac{y^2}{16(\frac{x^2}{9}-1)} + \frac{z^2}{2(\frac{x^2}{9}-1)}=1}$. Proceeding as above we write:
>> [x,th] = meshgrid(3:.5:10, 0:pi/25:2*pi); >> y = sqrt(16*(x.^2/9 - 1)).*cos(th); >> z = sqrt(2*(x.^2/9 - 1)).*sin(th); >> surf(x,y,z) >> hold on >> surf(-x,y,z) >> axis equal

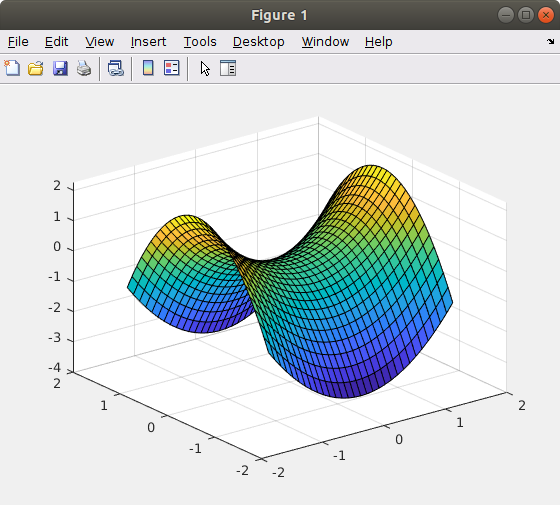
Hyperbolic paraboloids can be plotted easily in a direct non-parametric form. See the plot of ${\displaystyle z = x^2 - \frac{3}{2}y^2}$ below.
>> [x,y] = meshgrid(-1.5:.1:1.5, -1.5:.1:1.5); >> z = x.^2 -1.5*y.^2; >> surf(x,y,z)