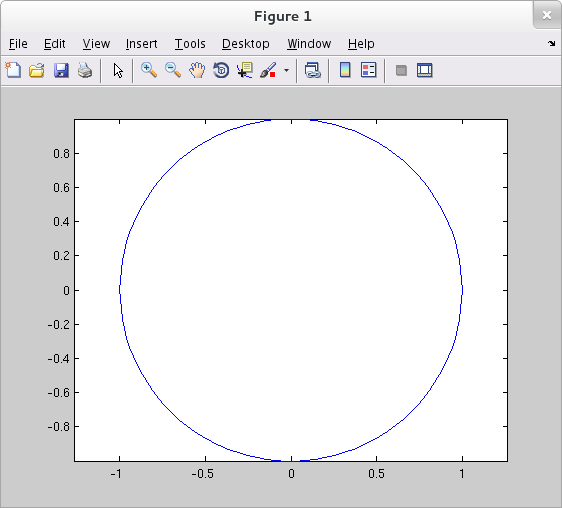
Here's a simple example using the basic MATLAB plot command with parametric equations.
>> t = linspace(0, 2*pi, 111); >> x = cos(t); >> y = sin(t); >> plot(x,y) >> axis equal
Note that the axis equal command sets the aspect ratio so the units are the same in the horizontal and vertical directions.
The following Sage interact illustrates trochoids. A trochoid is the path traversed by a point on a spoke of a wheel that moves along a horizontal line without slipping. Drag the slider to determine how far to move the wheel along the $x$-axis.