This page presents a MATLAB assisted solution to Exercise 7.5 #89.
The continuous extension of $(\sin{x})^x$ to $[0,\pi]$
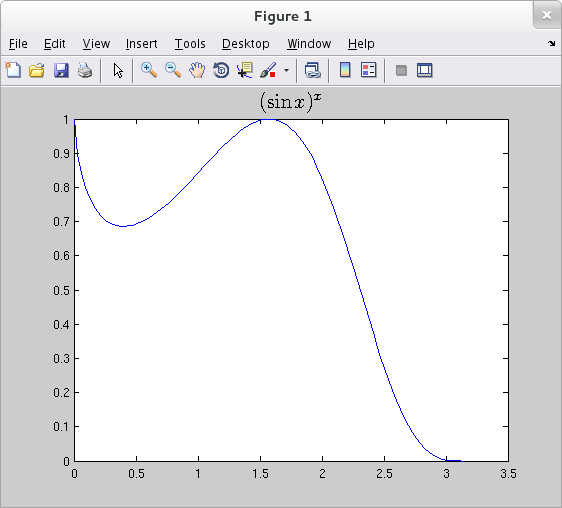
(a) Graph $f(x)=(\sin{x})^x$ on the interval $0\leq x\leq\pi$. What value would you assign to $f$ to make it continuous at $x=0$?
>> x = linspace(0,pi,100);
>> y = sin(x).^x;
>> plot(x,y)
>> title('$(\sin{x})^x$', 'Interpreter', 'Latex','FontSize',16)
From the plot it appears that we should define $f(0)=1$ to make $f$ continuous at $0$.
(b) Verify your conclusion in part (a) by finding $\lim_{x\rightarrow 0^+}f(x)$ with l'Hôpital's Rule.
${\displaystyle \lim_{x\rightarrow 0^+}(\sin{x})^x =
\lim_{x\rightarrow 0^+} \exp{(x \ln{(\sin{x})})}}$
${\displaystyle =
\exp{(\lim_{x\rightarrow 0^+}x \ln{(\sin{x})})}}$ by continuity of the exponential function
${\displaystyle =
\exp{(\lim_{x\rightarrow 0^+}\frac{\ln{(\sin{x})}}{1/x})}}$
${\displaystyle =
\exp{(\lim_{x\rightarrow 0^+}\frac{\frac{-\cos{x}}{\sin{x}}}{\frac{-1}{x^2}})}}$
by l'Hôpital's Rule ($\frac{-\infty}{+\infty}$ case)
${\displaystyle =
\exp{(\lim_{x\rightarrow 0^+}\frac{x\cos{x}}{\frac{\sin{x}}{x}})}}$
${\displaystyle =
\exp{\left(\frac{\displaystyle \lim_{x\rightarrow 0^+}x\cos{x}}{\displaystyle \lim_{x\rightarrow 0^+} \frac{\sin{x}}{x}}\right)}}$
${\displaystyle = \exp{\left(\frac{0}{1}\right)}}$
$ = 1$
(c) Returning to the graph, estimate the maximum value of $f$ on $[0,\pi]$. About where is max $f$ taken on?
(Note: From the problem statement it appears we should now interpret $f$ to mean the-continuous-extension-of-the-original-$f$-to-$[0,\pi]$.) From the graph it appears that the maximum value of $f$ on $[0,\pi]$ is $1$, and that this max is taken on both at the left endpoint $x=0$ and at an interior point near $x=1.5$. Of course, however, we cannot definitely declare an exact tie based on visual inspection of the graph alone.
(d) Sharpen your estimate in part (c) by graphing $f'$ in the same window to see where its graph crosses the $x$-axis. To simplify your work, you might want to delete the exponential factor from the expression for $f'$ and graph just the factor that has a zero.
>> syms x f fp g >> f = (sin(x))^x; >> fp = diff( f ) fp = log(sin(x))*sin(x)^x + x*cos(x)*sin(x)^(x - 1) >> g = simplify( fp/(sin(x)^(x-1)) ) g = log(sin(x))*sin(x) + x*cos(x) >> ezplot(g, [1.4 1.6]) >> hold on >> ezplot('0', [1.4 1.6])
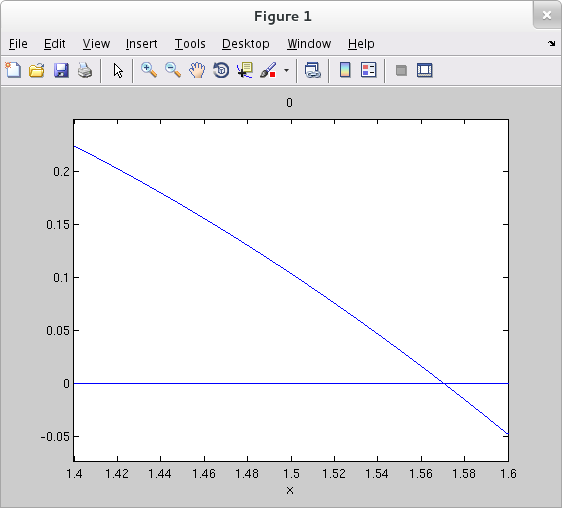
Since $(\sin{x})^{x-1}$ doesn't have a zero on the interior of $[0,\pi]$, the function $g$ must be zero at the interior point where $f'$ is zero. From the graph we see this occurs near $x=1.57$. (We've taken the liberty not to plot $g$ in the same window as $f$. That requirement of the problem statement is counter-productive.) Notice that $1.57$ is very nearly equal to the special value $\frac{\pi}{2}$, and that it's easy to verify that $f'$ is exactly zero at $x=\frac{\pi}{2}$ and $f$ indeed assumes its global max (over $[0,\pi]$) of exactly $1$ at both $0$ and $\frac{\pi}{2}$.